Introducing Illustrate Digital’s 2024 Global Page Speed Report
Page speed and website performance are increasingly important factors in the user experience of any site. In fact, if it’s not one of your measurable marketing metrics in 2024 then you may just be at risk of lowering your overall performance.
For example, it’s reported that B2B websites taking only 1 second to load have a conversion rate 5x higher than sites that take 10 seconds to appear.
In the eyes of Google, which retains a search engine market share of 84%, page speed is an increasingly critical factor in search performance. Combine this with stats about the decreasing attention spans of web users and it shouldn’t take much to convince organisations that a fast-loading website could be the difference between success or defeat.
This is exactly why we’ve poured countless hours into researching global website performance, across multiple sectors, to create our 2024 Global Page Speed Report.
Whether you’re here for research, finding data to convince your stakeholders to invest in site speed, or anything in between, we hope you find this data valuable. Feel free to use and reference it!
Contents:
- Are you wasting time waiting for websites to load?
- Page speed results worldwide
- Page speed results by sector
- Why is page speed important
- How to test your site speed
- Ways to speed up your website
- How we performed our research
Are you wasting time waiting for websites to load? ⏰
We’ve spent over 200 hours researching, analysing and preparing our 2024 page speed report. You can imagine we’ve collected quite the dataset!
But this is what it all comes down to, a pretty eye-opening statistic that looks at how much time every year we each spend waiting for websites to load. Spoiler alert… it’s a lot!
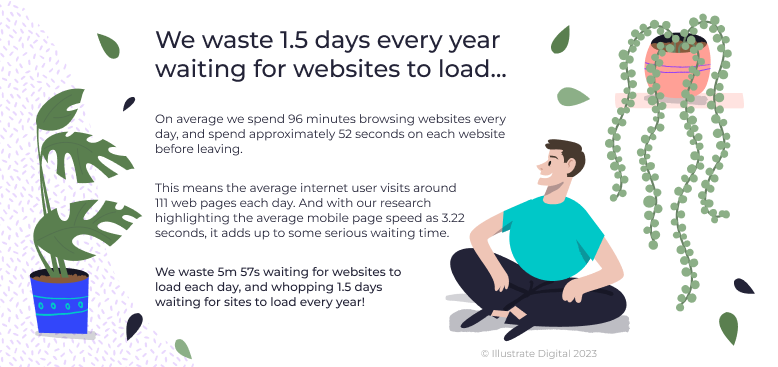
By the way… these numbers don’t include people who work using the internet for a living. If you do, you could be wasting a lot more time.
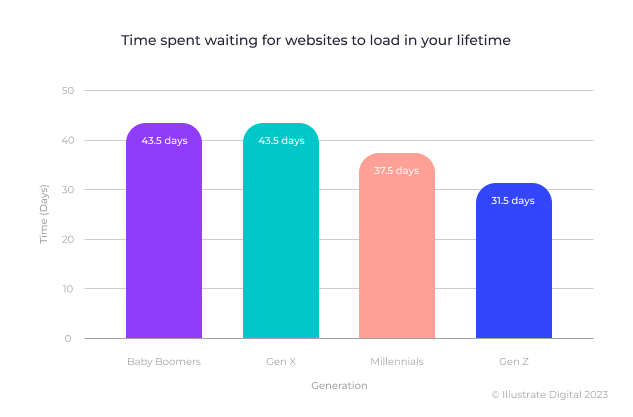
How long has each generation wasted waiting for websites to load?
Needless to say, we thought 1.5 days was a pretty shocking number. Then we started thinking about all the time we might’ve wasted during our lifetimes so far, and that was even more scary!
Looking at a typical Baby Boomer, who might’ve started using the internet in 1994, they could’ve spent 43.5 days waiting for websites to load… and that’s just based on the speed of sites today! Remember dial up? It doesn’t bear thinking about how much time could’ve actually been wasted.
Given they’ll have been using the internet for a similar length of time, Gen X also weighs in with 43.5 days of wasted time in their lifetime, whilst Millenials hadn’t grown up enough by 1994 and adopted the internet later on, wasting 37.5 days.
And finally, the average child of Gen Z, the first generation not to remember a time before the internet, would’ve wasted 31.5 days so far. Given the average age of someone from Gen Z is 18 right now, that’s nearly 0.5% of their life wasted waiting for websites to load!
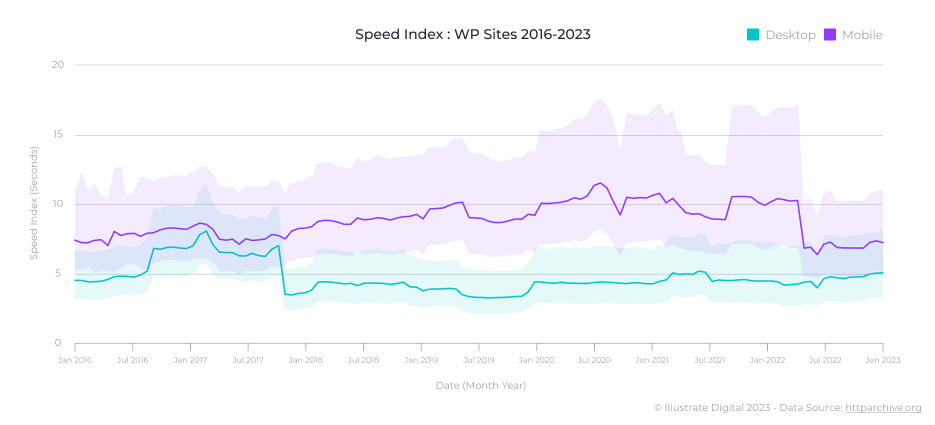
Has the speed of WordPress websites improved in the last seven years?
Worth mentioning is some of the interesting information we found during the course of our research. When looking at the progress of site speed improvements over time, we learned that performance hasn’t actually improved in the last seven years.
Yep, you read that right… Websites are just as fast/slow today as they were seven whole years ago, there’s been little-to-no improvement?
The data below, based on sites using WordPress between January 2016 and January 2023, shows little to no progress. Site speed worsened by 6.7% on desktop devices, and improved 8.1% on mobile (though it’s worth pointing out that Google’s testing switched from 3G to 4G in May 2022, hence the mobile improvement).
So why is this? Well, the answer is fairly simple. We’ve not all stopped innovating or developing better websites, but progress has been accompanied by confusion.
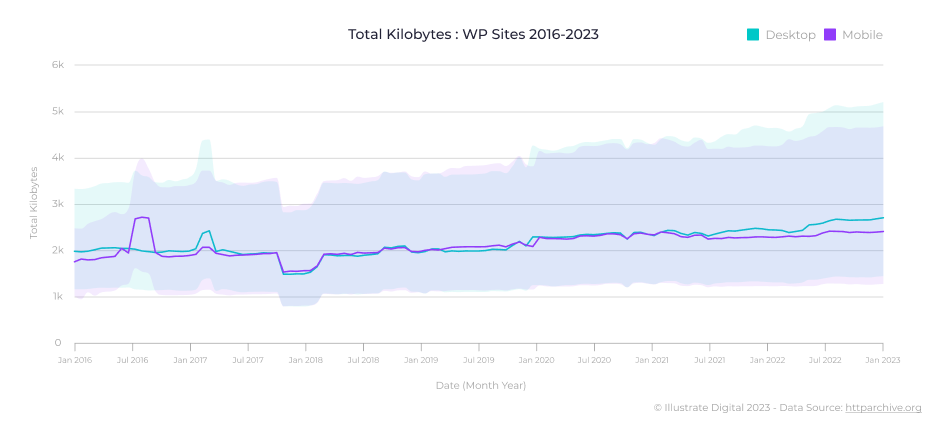
Making websites more complex means bringing a lot more back-end technology along on the journey, it’s caused ‘website bloat’ and ultimately meant speeds haven’t improved in the last seven years.
In fact, the data below shows exactly what has happened to the ‘weight’ of websites using WordPress over the same reporting period. Both desktop and mobile websites have seen an increase in page weight of around 35% in the last seven years. The average desktop site weighs 2.6 megabytes (up 34.2%), whilst the average mobile site in January weighed in at 2.3 megabytes (up 36.4%).
Global page speed results
Let’s take a look at what our research tells us about page speed and website performance from across the world.
This high-level view of global site speed is divided into three areas: worldwide, the UK and the US. The data itself compares the top 50 websites by traffic in each of the categories. Here are the results…
What is the average page speed worldwide?
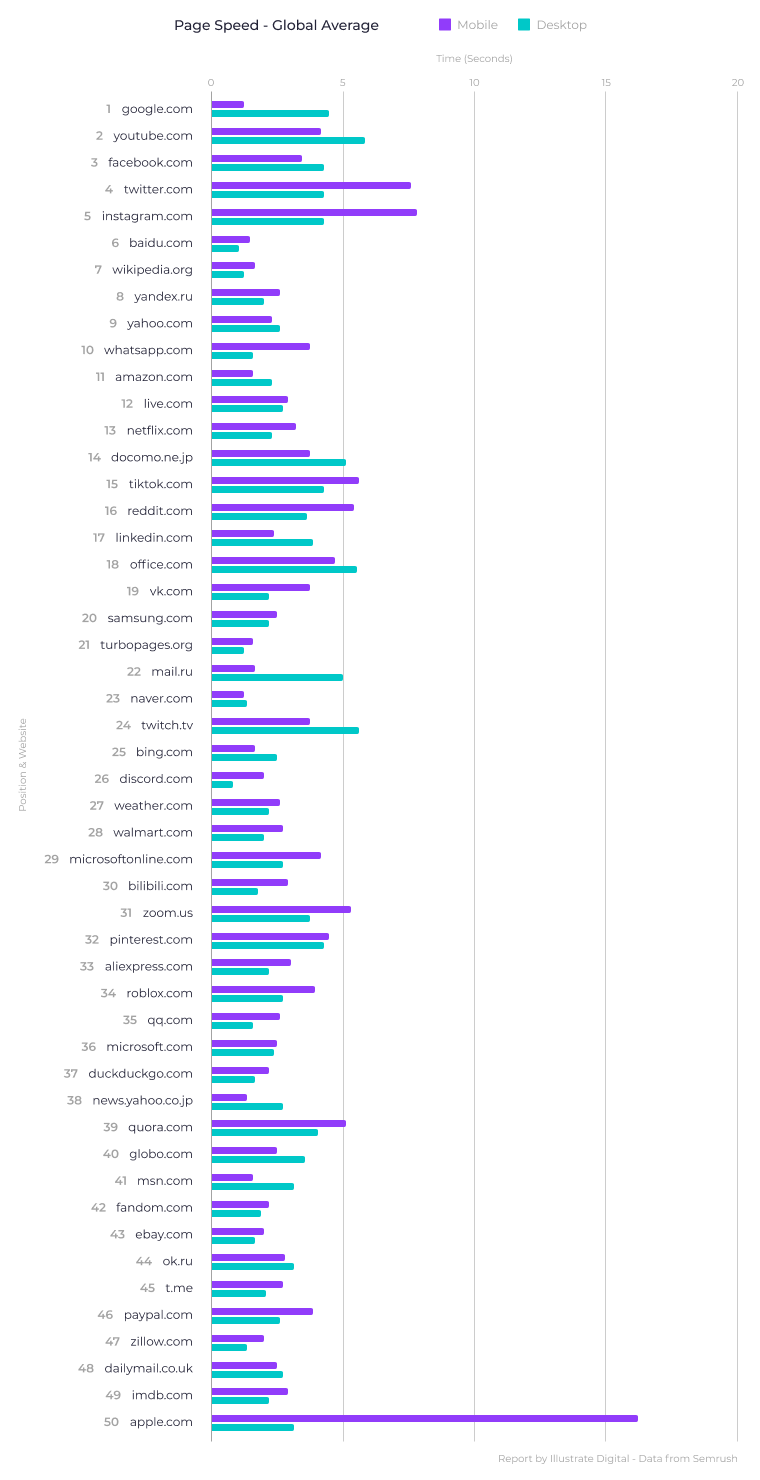
Across the globe, the average time we spend waiting for websites to load is 3.2 seconds on mobile devices and 2.8 seconds for desktop users.
The world’s joint fastest websites on mobile devices are Google.com and Naver.com at 1.2 seconds. For Google this is comforting considering their drive to educate the world on the user-focused benefits of faster website performance. For Naver it’s nothing short of impressive considering the sheer amount of content they’re loading at first glance.
The slowest mobile website on our worldwide leaderboard is Apple.com at a whopping 15.6 seconds! Although it does make some sense given their love for high quality graphics to show off the beauty of their product. Perhaps a price worth paying? After all, they’re still the most valuable company in the world.
Worth a special mention is the Discord.com website, the actual fastest website on our list across mobile and desktop, with blazing speeds of 0.8 seconds on desktop and a still impressive result of 1.9 seconds on mobile.
What is the average page speed in the UK?
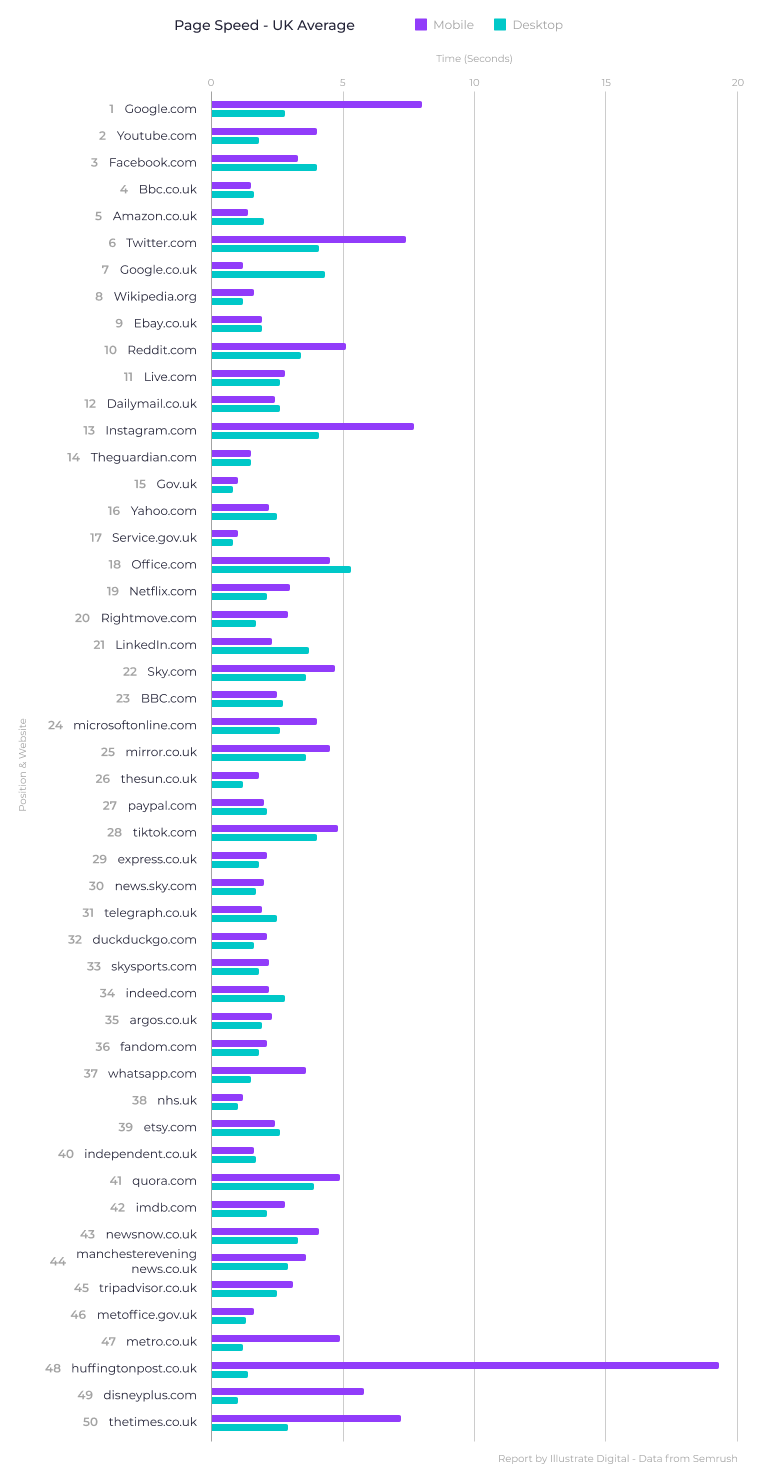
Compared to worldwide average, the UK has some catching up to do on mobile with speeds of 3.5 seconds, though tends to be significantly faster on desktop with speeds of 2.4 seconds.
The UK’s fastest websites both spring from the UK Government with both gov.uk and service.gov.uk coming in at an incredibly quick 1 second on mobile and 0.8 seconds on desktop. With the UK Government having paid significant attention to the digital accessibility and usability of their services, it’s no surprise to see these websites ranking as some of the most used and also speediest websites in the UK. Well done, UK Gov!
On the other end of the scale with a dire speed ranking of 19.3 seconds on mobile is huffingtonpost.co.uk. They’re pretty speedy on desktop at 1.4 seconds, but they’ve got to get that critical mobile speed down.
What is the average page speed in the US?
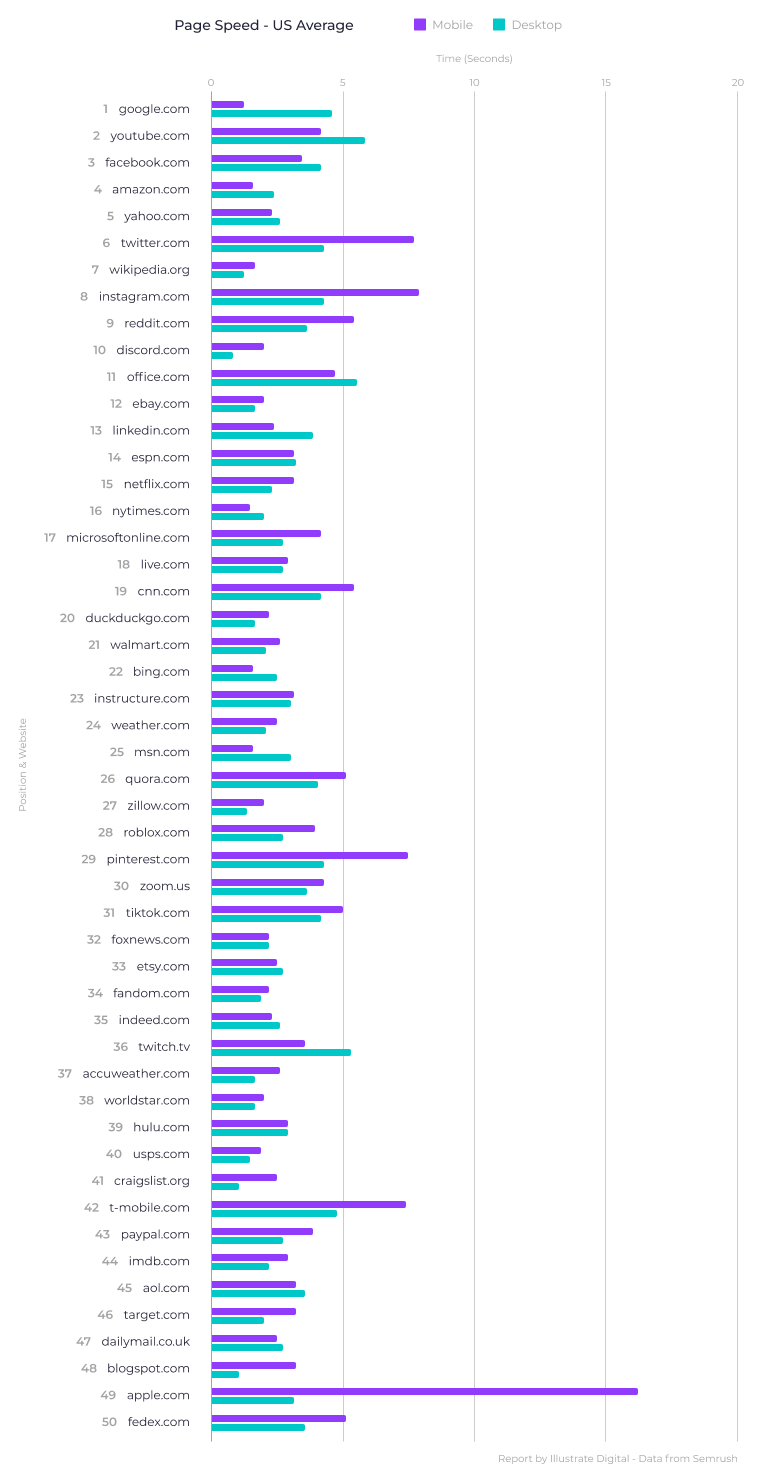
And when it comes to the biggest sites in the US, they appear to average slower overall than both worlwide and UK statistics, with 3.5 seconds on mobile devices and 2.8 seconds for desktop users.
The most-used website in the US also has the fastest mobile website, and you probably won’t be surprised to discover it’s Google.com with a result of 1.2 seconds. Although their desktop rating seems to be a bit sluggish in comparison at 4.4 seconds. Hmm.
The slowest mobile website is again Apple.com with that (maybe understandably) sluggish 15.6 seconds, although their desktop site is faster than Google at 3 seconds.
Page speed results by sector
As part of our research we’ve delved into 12 different sectors to see how they compare. The results are both insightful and fascinating, as we compare very different industries that serve entirely different purposes. It shows that some sectors are way more user-focused than others, perhaps even better at embracing and improving technology to achieve these results.
Regardless of the results, we’d be willing to bet every brand in every sector wants their audience to be on-site and engaged as much as possible for as long as possible. What’s clear is that some sectors have more work to do than others to achieve this!
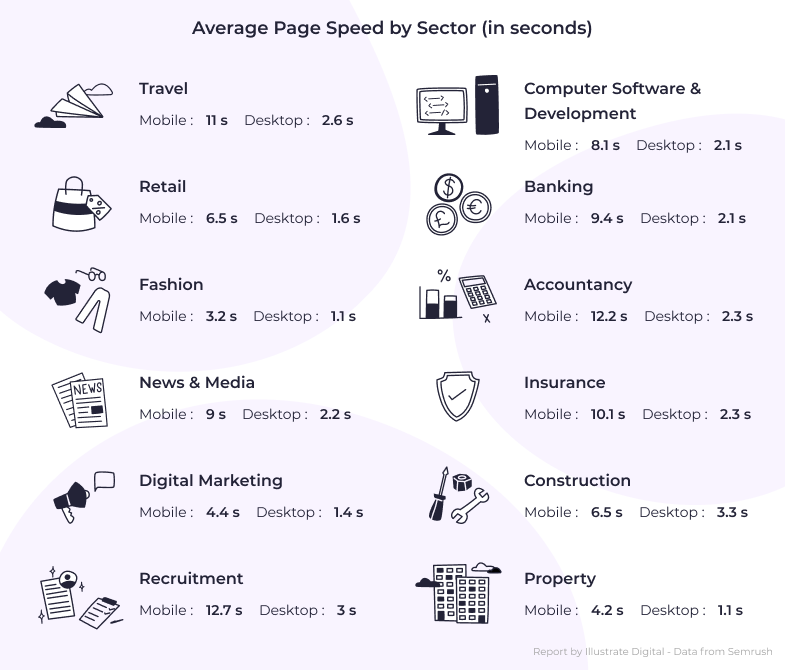
In 2023 the fashion industry had, on average, the fastest load times of any other sector, followed by property and digital marketing.
On the other end of the scale, recruitment and accountancy were among the slowest loading websites globally.
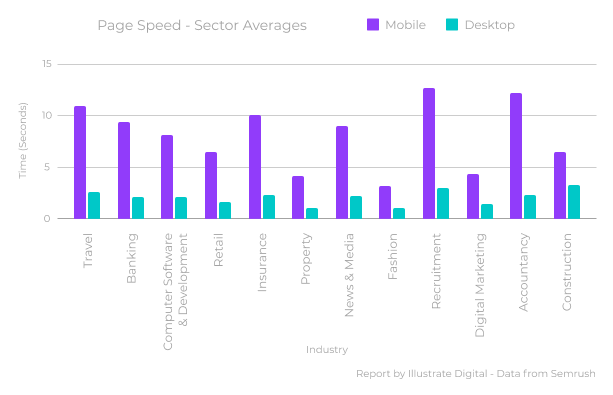
When you compare these sector averages to the global averages, you can pretty quickly see how far the gap between mobile and desktop speeds begins to widen. Whilst web designers and developers often place great value on achieving fast mobile speeds, it can be challenging to achieve without proper investment. Why? Because mobile speeds around the world are still throttled by slower connections like 3G and 4G. To conquer this, organisations should consider working with developers to build mobile experiences that serve lighter content that’s more appropriate for smaller screens and slower connections.
While the average desktop page speed floats between 2 and 4 seconds, those using desktop browsers are waiting within a much broader time scale – anywhere from 4 to 13 seconds per page. Remember, these are the top websites in each sector by usage. Waiting 13 seconds for a website that has millions of visitors isn’t a great statistic!
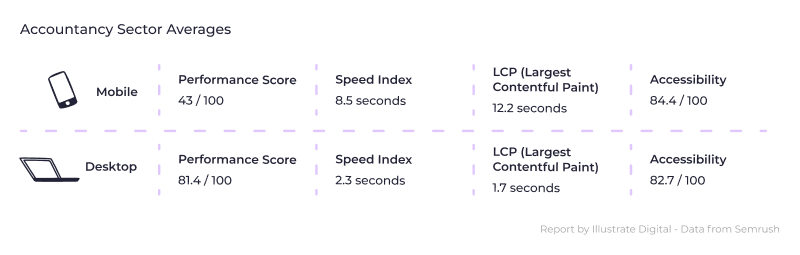
Accountancy sector page speed results
The accountancy sector shows one of the slowest averages of any sector in our report, with some pretty rubbish results from some really big names in accounting.
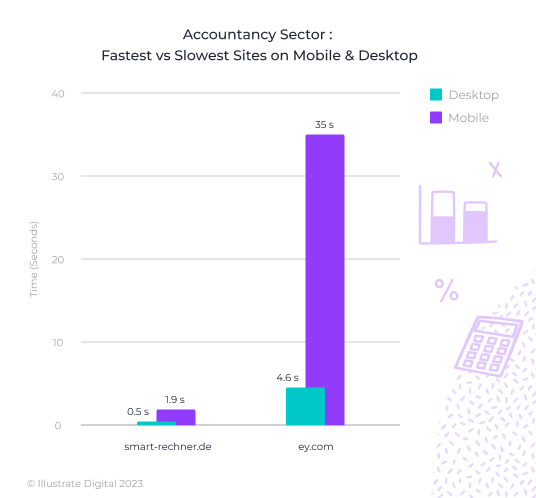
Let’s start with the positives though… whilst smart-rechner.de may not be one of the prettiest websites on the internet, it certainly is one of the fastest and is used by more than 35 million German users every year. Coming in as one of the fastest websites in all of our research, smart-rechner.de has a rating of 0.5 seconds on desktop and 1.9 seconds on mobile. Exceptional!
On the other end of the scale is ey.com. One of the biggest names in accounting and consultancy, but one of the slowest websites in our entire dataset. What’s more, with a speed of 35 seconds on mobile, ey.com is ten times slower than their competitor kpmg.com at 3.5 seconds.
Overall the accountancy sector isn’t too bad, but certainly has work to do when it comes to user experiences on mobile.
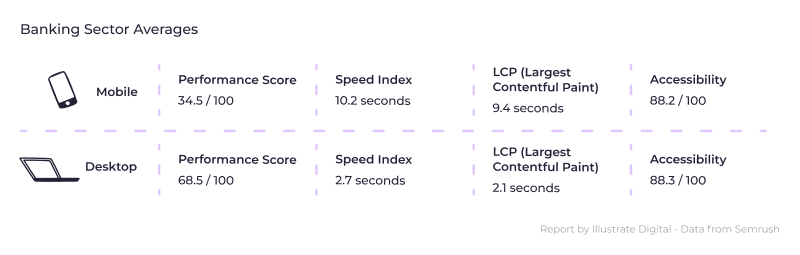
Banking sector page speed results
Despite the banking sector having some serious technology innovators and fintechs in the mix, the average performance metrics in this sector are way below global averages.
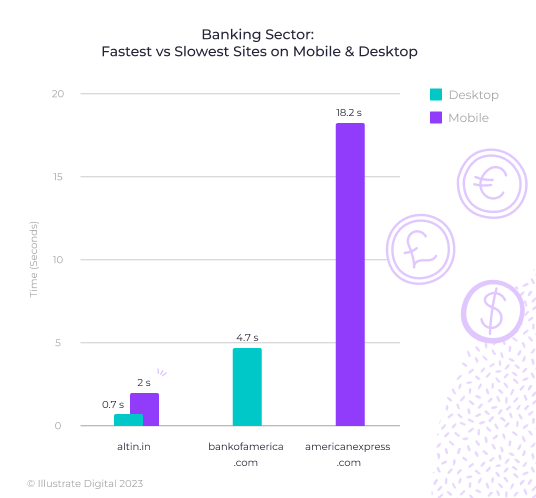
The best performer is Turkish brand altin.in with the quickest speeds on both mobile and desktop. They come in at a speedy 0.7 seconds on desktop and a still very impressive 2.0 seconds on mobile.
The slowest performer on desktop devices is bankofamerica.com at 4.7 seconds – not dreadful but certainly below our global averages.
The slowest performer overall is americanexpress.com. Whilst their desktop site is pretty speedy at 2.4 seconds, their mobile site is painfully slow at 18.2 seconds. A shame for a brand whose technology and user experiences are usually pretty spot-on and well-rated!
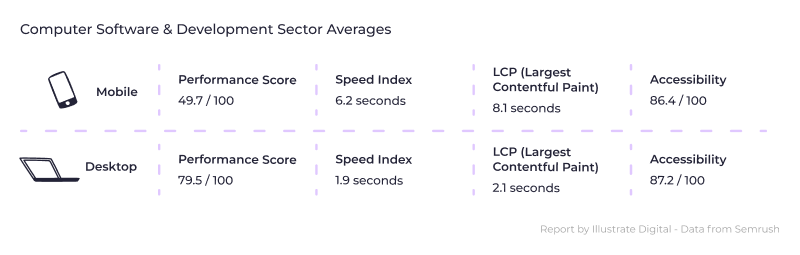
Computer software and development sector page speed results
You’d hope that the computer software and development sector doesn’t disappoint when it comes to site speed and the average results aren’t too bad at all. In fact, this is a category with some exceptionally fast sites, with averages pulled down by some really slow performers.
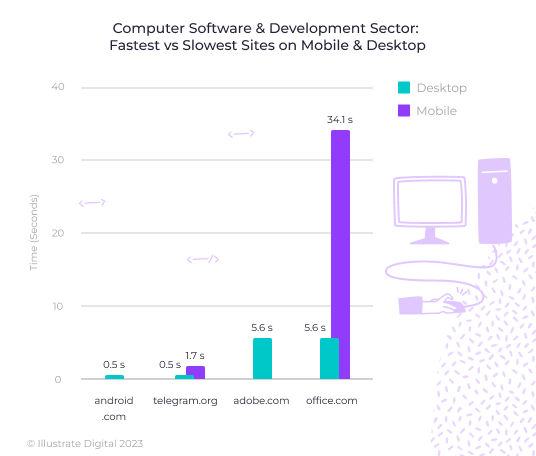
Joint speediest of all sites in this sector are android.com and telegram.org with a trailblazing 0.5 seconds page speed on desktop, whilst telegram.org also takes the top spot for mobile performance at 1.7 seconds.
A pretty poor performer has popped up in this category with office.com taking a sluggish 34.1 seconds to load on mobile devices. Ouch.
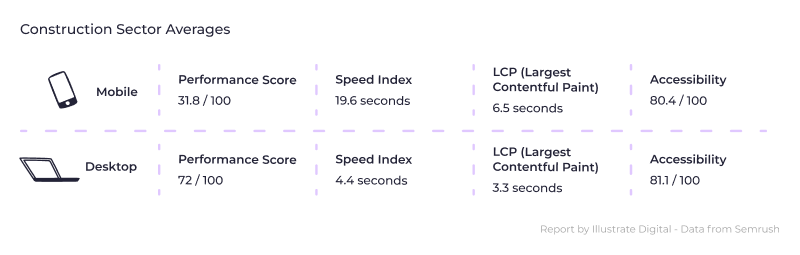
Construction sector page speed results
Giving the construction sector the benefit of the doubt, it’s pretty jam-packed with application based websites that we’d expect to take a little longer to wake up and deliver greatness to their users. Regardless, the construction sector doesn’t come up too bad in our sector averages, and is far from having the most poor performing websites. Well done, construction!
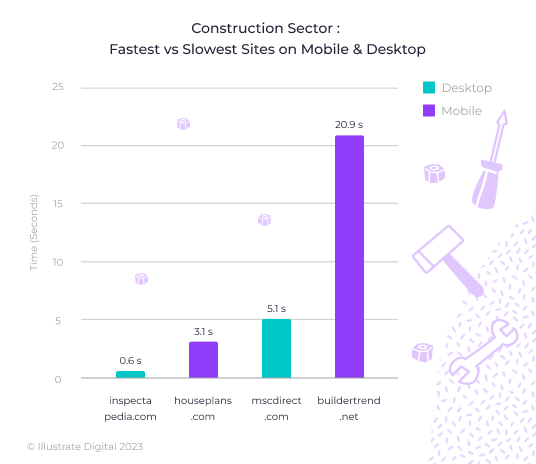
In the top spot for website performance in the construction industry is inspectapedia.com with a lightning-fast desktop speed of 0.6 seconds. Joined by houseplans.com with a 3.1 second load speed on mobile.
Trailing behind in the construction sector is buildertrend.net with a mobile site speed of 20.9 seconds on mobile. That’s 14.4 seconds slower than the sector average, or more than 3 times slower than the average construction website on mobile.
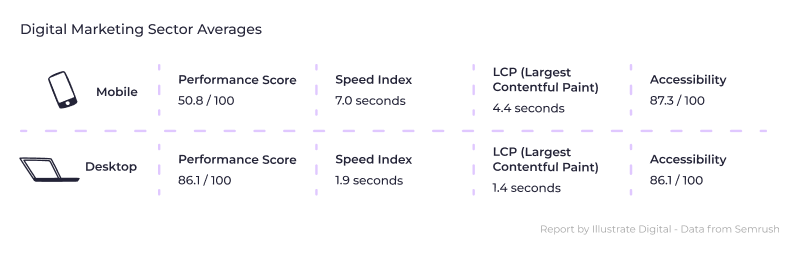
Digital marketing sector page speed results
The digital marketing sector isn’t disappointing when it comes to site speed and seems to practice what it preaches in terms of performance. In fact, the digital marketing sector is pretty well aligned with global averages and outperforms the world’s top websites when it comes to desktop performance.
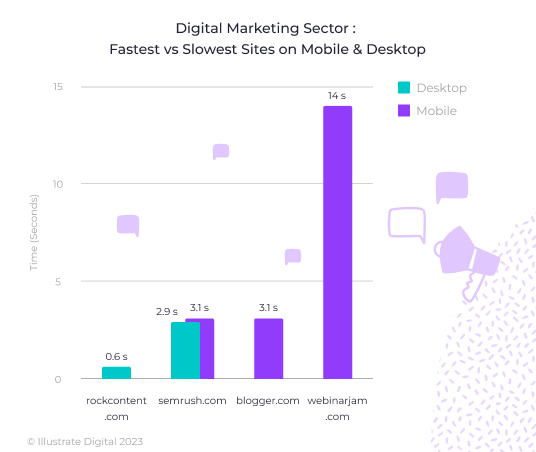
The best website in digital marketing for site speed is rockcontent.com, boasting a speedily impressive 0.6 second site speed on desktop. That’s accompanied by the leaders in mobile speed, semrush.com and blogger.com at 3.1 seconds.
Rather impressively, the slowest performing desktop site in digital marketing takes just 2.9 seconds to load, which also comes from semrush.com. That’s still pretty fast!
The slowest performing mobile site is from webinarjam.com and takes 14 seconds to get alive and kicking.
Fashion sector page speed results
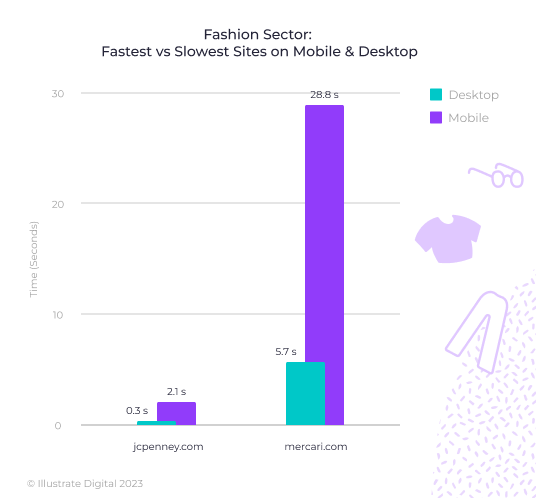
Page speed results in the fashion sector are treating us to some really good numbers, especially when it comes to browsing their sites on desktop devices.
One website in particular blows all others out of the water when it comes to website performance, and that’s jcpenney.com with the fastest of all websites throughout our report, boasting 0.3 seconds on desktop and 2.1 on mobile. Blink and you might miss it!
The fashion sector is also home to one of the slowest performers, mercari.com. Whilst the site may be pretty sleek visually, it takes 5.7 seconds to load on desktop and a super slow 28.8 seconds to load on mobile.

Insurance sector page speed results
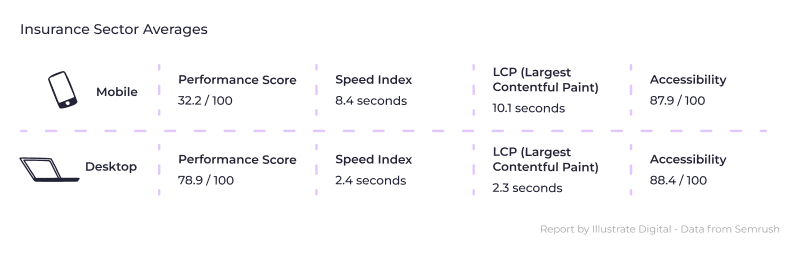
Whilst the insurance sector’s desktop results are pretty close to the global average for the world’s largest sites, the average mobile performance still needs some work!
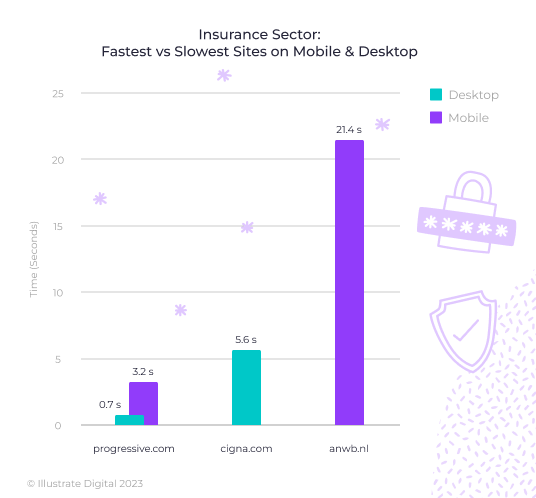
The rather aptly named progressive.com is the top performer in Insurance. At 0.7 seconds on desktop and 3.2 seconds on mobile, this fresh-thinking insurance company is as progressive with its website as its name suggests.
Going slow on mobile devices is Netherlands based anwb.nl, taking 21.4 seconds to load. Considering they’re all about roadside assistance, you might expect a slightly faster response from their website. Oops!
News and media sector page speed results
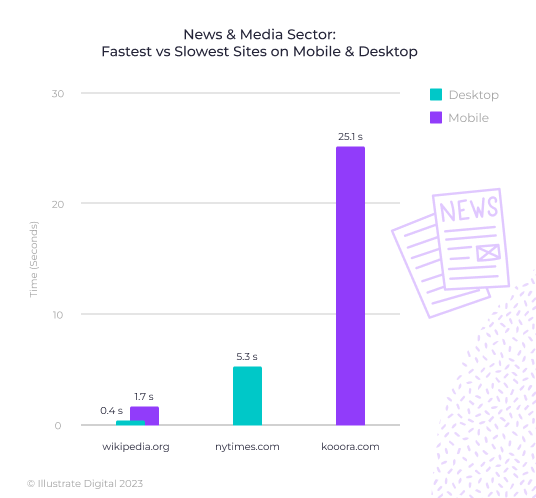
The news and media sector provides an interesting anomoly when it comes to website performance. Why? Because a lot of the sites in this sector rely on adverts for revenue, and often those adverts get served dynamically depending on a number of factors.
Still, the overall scores for this sector aren’t terrible. You may just want to consider using a desktop to view a lot of them, otherwise you may get frustrated attempting the mobile experience if the average is 9 seconds per page!
Unsurprisngly, the very unfussy wikipedia.org scores highest in this sector with a lightning 0.4 seconds on desktop and a still pretty nifty 1.7 seconds on mobile. Surely site speed plays a bit part in many people flocking there regularly for reliable information.
On the other end of the scale you’ll find the Arabic sports site kooora.com, which despite speedy desktop speeds, takes 25.1 seconds to load on mobile devices.

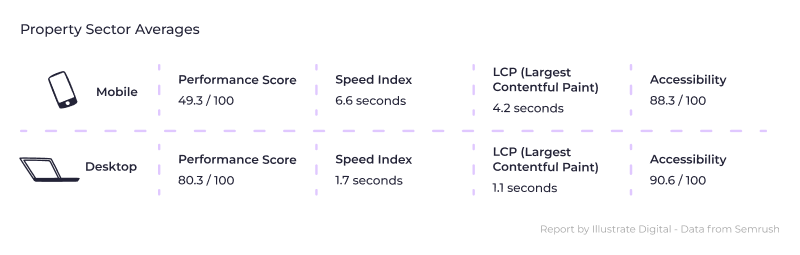
Property sector page speed results
The property sector knows how to build fast performing websites, with some of the most impressive averages from across the sectors we researched. In fact, the property sector also boasts the highest accessibility rating of any industry, rated 90.6 out of 100 on desktop devices.
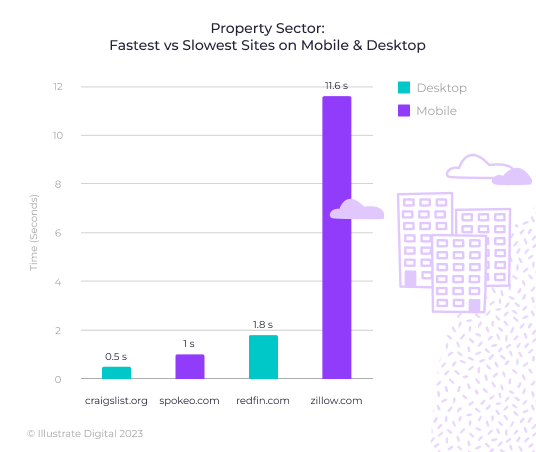
Leading the property sector is craiglist.org with a mightily impressive 0.5 second load speed on desktop devices. This is accompanied by spokeo.com with a properly lightning fast 1.0 second loading speed on mobile, only beaten by a couple of websites from our recruitment and retail sector results.
Falling not too far behind is redfin.com with the property sector’s slowest desktop site, although it’s still a speedy 1.8 seconds, so not much time spent waiting there.
Where you’ll be waiting the longest when browsing websites in the property sector is zillow.com with an 11.6 second load time on mobile devices.
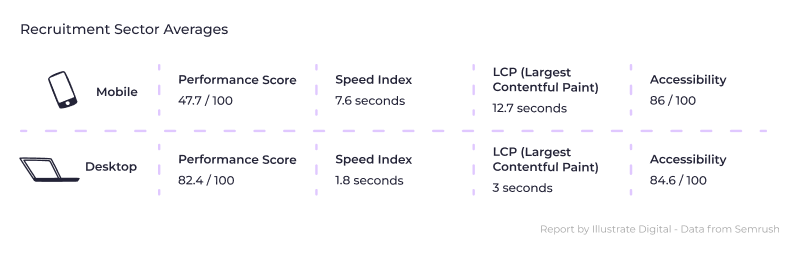
Recruitment sector page speed results
When it comes to the recruitment sector they may be slower on averages than some other industries, but they certainly boast some of the quickest websites from any category. Let’s take a look…
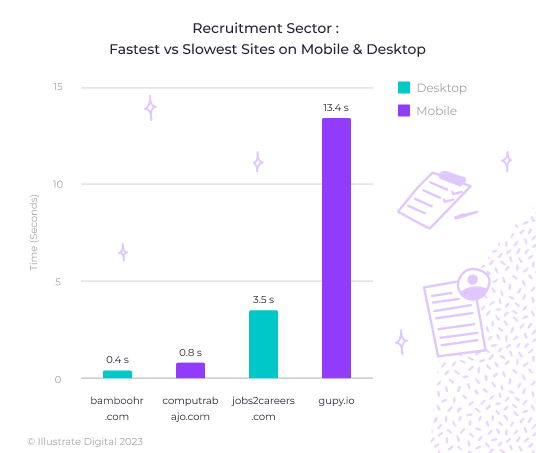
Coming in with a rapid result is bamboohr.com, taking just 0.4 seconds to load their desktop site, with mobile not falling too far behind at a still speedy 1.2 seconds. A result that puts a smile on our user-focused faces when it comes to a brand that shows it cares about its user experience.
Also looking pretty good is Spanish site computrabajo.com, and definitely worth a special mention, as it’s joint first place for mobile site speed across our entire dataset with a lightning fast 0.8 seconds on mobile. Fantástico!
Lagging somewhere behind in the recruitment sector is jobs2careers.com with a desktop result of 3.5 seconds, and gupy.io with a leisurely 13.4 second waiting time on mobile devices.
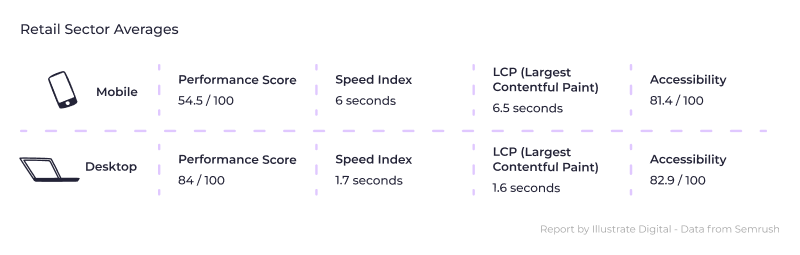
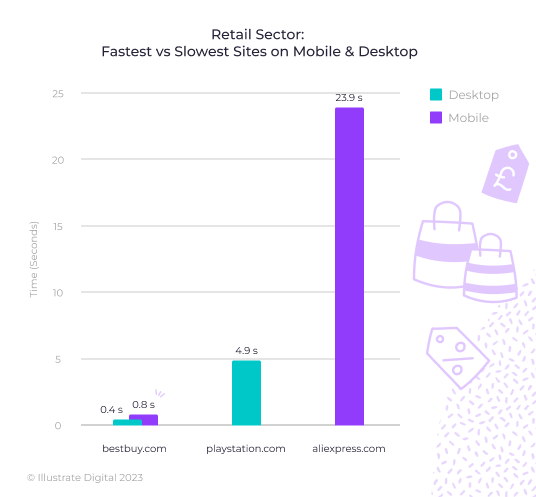
Retail sector page speed results
In the retail sector, more than most others, traffic often translates to revenue. Engagement and site speed are absolutely crucial performance metrics for retail brands, so let’s take a look at the fastest and slowest performers.
The stand-out leader in retail is without doubt bestbuy.com, providing us with the quickest results on both mobile and desktop. On mobile we’re treated to a nifty 0.4 seconds, whilst desktop isn’t too far behind with 0.8 seconds. It’s rare for both mobile and desktop results to score below the one second mark!
Producing pretty shocking results in retail speed is global retail superpower, aliexpress.com. The site takes a tedious 23.9 seconds to load on mobile devices, which is even more astonishing given Alibaba’s quarterly revenue of almost $36 billion reported in December 2022.
And for desktop devices, playstation.com is the slowest of the world’s top retail websites, taking 4.9 seconds to load. Whilst high quality imagery is inevitably important for the virtual gaming brand, could there be ways to further optimise this to improve the experience?
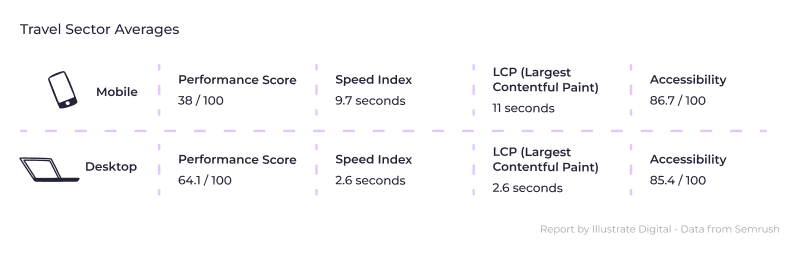
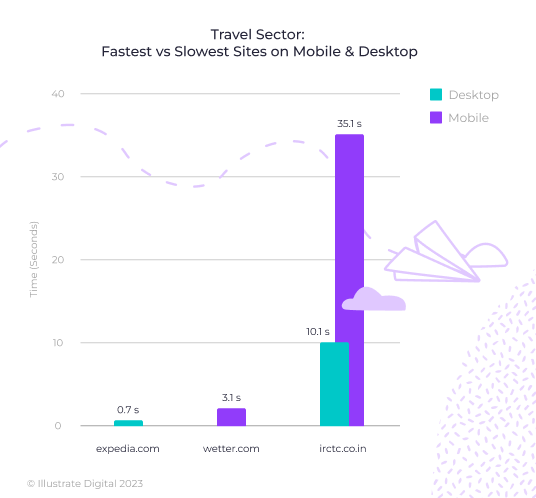
Travel sector page speed results
What went wrong with the travel sector? This category boasts the slowest page speed scores for both desktop and mobile. It turns out the Indian Railway’s irctc.co.in is what went wrong, providing an abysmal 10.1 second load time on desktop and an even more woeful 35.1 seconds of waiting time on mobile!
On the other end of the scale is expedia.com, a site that’s kept each page simple enough to lower the time it takes to load each page, whilst still serving us with the great images you’d expect to entice us to travel. This pretty speedy site takes just 0.7 second load time on desktop.
Also on the faster side of the travel sector is German weather site wetter.com, taking 3.1 seconds to load on mobile devices, despite the hefty amount of content and live info they’re serving.
Why page speed is important
Website speed, or page speed, refers to how quickly a browser is able to load fully functional web pages from a given site. How quickly a website loads up can have a huge impact on whether or not a user decides to stay and browse the site, or go elsewhere to greener pastures.
Studies show that 39% of people will stop engaging with a website if images won’t load or take too long to load, which is why page speed is a key metric when it comes to providing a great digital experience.
A fast-loading site will typically receive more traffic and have optimal conversion rates. While on the flip side, slow site speed can result in poor search engine rankings, lower overall site traffic, and negative user experiences.
Website conversion rates drop by an average of 4.42% with each additional second of load time (between seconds 0-5), so if you are planning to improve your digital marketing strategy this year – you may want to make page speed a top priority.
How to test your site speed
You can evaluate your own page speed with Google PageSpeed Insights. It’s the same tool used by experienced development agencies just like Illustrate Digital and helps us to gather valuable insights on how Google views your performance. They created the tool as a way of encouraging developers and website owners to not only improve, but to care about the quality of the experience they’re creating for website users.
PageSpeed Insights is the tool we’ve used to carry out our research for this report and is also counted as a key ranking factor for Google’s search results. Check it out today and see how your site stacks up against worldwide and sector averages for site speed.
Ways to speed up your website
If you’ve been reading our report and feel inspired by some of the impressively fast user experiences on show from some of the world’s top websites, or if you’ve been stirred by the poor experiences on offer from the slower sites in our report, the good news is it’s possible to speed up your website.
There are several ways to go about this, and it doesn’t always require a full rebuild or rework of your existing site.
Our team has invested a tonne of time perfecting the art of page speed, and it’s possible to help progress most sites into something that’s fast-loading and joyous to use.
So, where do you start? There are a few key areas you can look at to begin speeding up your site:
Investing in a great hosting infrastructure
It can’t be understated how much of a difference the right hosting infrastructure makes to site speed, in fact we’d say it’s the most important choice for performance. Think about your platform, your content and everything that makes up your site, then bring in the best solution that fits those particular requirements.
CDN and offloading other resources
In the last 10 years, as a society, we’ve only been making websites more complicated. The content may be great for users, but does it all need to load from your content management system? You should also look for a good CDN (content delivery network) to help make images load faster, and think about other ways you can externalise your resources (such as headless integrations).
Only use third-party tech on your site that’s truly valuable to users
We’re not saying don’t integrate your site at all, but consider which integrations and services might be adding extra waiting time to the experience of your site. Is there another way, another method, or another service that provides a better product to integrate with? Prioritise speed in your integration decisions (not to the detriment of user interface or operational efficiency, of course – it’s a balance!).
Optimise images
Maybe an obvious point – make sure you’re optimising your site’s images as much as possible without degrading their quality. Images and other media items are often the biggest culprits in sluggish site speed. In particular think about how many images you’re loading on smaller screens and consider whether less is more, especially because less equals faster.
If you’re using a content management system, monitor your database queries
Heavy and slow database queries can have a big impact on site speed, so identify and optimise them for better performance. A good plug-and-play option for WordPress is the Query Monitor plugin. Or, at server-level, it’s worth checking out products such NewRelic to get to grips with your database and server performance.
Consider going ‘headless’
Using a JavaScript framework, you could consider decoupling the front end of your site from what’s likely a complicated CMS. By using a framework such as Next.js or Gatsby.js, known for their speed, you can achieve the best of both worlds. This type of setup is called headless, separating what your users see on the front end of your website from the clunkiness that might be lurking in your CMS. Doing this, you can deliver a lightning fast experience whilst still enjoying the comforts and functionality of your favourite content management platform.
How we performed our research
It’s important to us that you can trust the report we’ve created, and enable you to use the data to help improve your own website’s performance by understandingt the impact it has on users worldwide, as well as in specific sectors.
Our research was performed over a 9 month period. Given the volume of research and testing required, it’s worth mentioning that the speed tests were not all performed at exactly the same time and so variances in data can be accounted for.
Looking forward our aim is to find methods to conclude the research and performance testing in a much shorter period of time to improve the accuracy and fairness of the results.
Here’s a look at how we performed our research…
Gathering and filtering global usage data
Whilst we’d explored a number of different potential data points that could help us to decide which websites to test for speed (and without getting too carried away testing millions of websites) we settled on the method of reviewing only the top websites by session volume in each global region or sector.
To source this global usage data our main initial research tool was Semrush, which would allow us to find the most visited websites worldwide, in the UK, the US and also in each of our chosen sectors: Accountancy, Banking, Computer Software, Construction, Digital Marketing, Fashion, Insurance, News & Media, Property, Recruitment, Retail and Travel.
Our worldwide dataset includes the top 50 websites in each segment. Our sector dataset includes the top 20 websites in each segment.
We also took the decision to filter out any questionable websites that we feel don’t align with our values as a business. Whilst the websites removed from each list proved minimal, each website was replaced by the next highest ranking site by session volume to keep our research consistent.
Performing site speed tests
From load speeds to accessibility, there are lots of factors that affect the performance of a website. Whereas some sites are geared towards fast-loading images, others are set up with ease-of-use in mind and so all of these elements can have varying impact on your overall user experience.
When performing our site speed tests on each website during our research we used Google PageSpeed Insights, focusing on certain key performance metrics. These included:
Performance score
The performance score in PageSpeed Insights is an overall score given that takes into account five key speed metrics:
- First contentful paint: the time at which the first text or image is visible
- Largest contentful paint: looks at when the largest element of the page has finished rendering. It can be assumed that this is the main content of the page and that users can use the actual content from this point on.
- Total blocking time: the amount of time a page is blocked from user input, e.g. a mouse click
- Cumulative layout shift: measures the layout shifts that occur as a page loads up
- Speed index: measures how quickly your page is visually complete above-the-fold
Accessibility
The accessibility rating analyses how easily people who use assistive technologies can use your website. Specifically, accessibility looks at elements like button sizes to ensure they’re suitable to tap, links to see whether they’re described well, and images to see whether alt text is specified (so that users with limited or no vision can use screen readers to understand what the image is about).
Analysing and evaluating performance data
For the majority of this report we focused on Largest Contentful Paint (LCP), which Google determines as the time it takes for the main content of the page to finish rendering. We chose this metric as the point the website becomes actually useful for the user (e.g. if you couldn’t start interacting with Apple.com’s cool graphic renders, or see the videos you’re able to choose from on YouTube, it’d be a pretty rubbish and arguably pointless experience).
From here, the road to creating our report was pretty simple… look at the slowest and fastest websites in each data segment, as well as working out the averages for desktop and mobile devices in those data segements. And that’s the data we’ve presented above!
We also created some top-level statictics looking at how long each person on average is wasting waiting for websites to load. Not all of the data to calculate this is available in fine detail (for example, it’s difficult to accurately the amount of time spent on websites alone, vs the amount of time spent using apps and other technologies), and so some assumptions were required whilst aiming to be as accurate as possible.
Contact us for more information
If this report is resonating with you and your organisation to improve your site speed, we may be able to help! Illustrate Digital is a web agency specialising in user research, designing user experiences, and developing globally leading (and highly performant) websites using the WordPress CMS.
Get in touch to explore the ways we can help to create fast, engaging digital experiences for your audience.
Likewise, if you’re from a media outlet or marketing department looking for more information or comment about our report, please get in touch and we’ll help where we can.